Sebago Technics completed a shoreline mapping project for Kittery in 2013. The shoreline project had two goals; the first goal was to more accurately depict the highest annual tide (HAT) elevation contours for Kittery to use in proposed revisions to their shoreland zoning maps. The second was to have the shoreline mapping serve to better map the shoreline depictions in Kittery for use inaccuracy improvements to their existing parcel map. This was accomplished by creating additional mapping products depicting the significant water lines for Kittery using elevation-based information and GIS mapping.
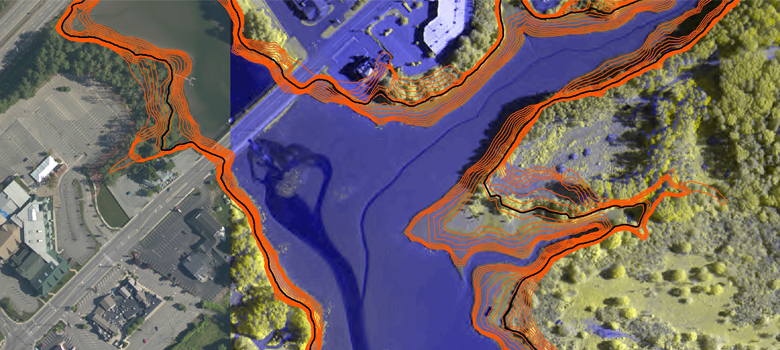
The creation of elevation-based GIS mapping was accomplished using CADD and GIS tools. The primary dataset used in this project was low-tide LIDAR that allowed us to map the entire shoreline from low water to high water and beyond. The LIDAR data allowed Sebago to create various elevation contours at intervals which corresponded to significant elevations in Kittery, such as the HAT line for 2013, the low water line, mean sea level, high water line, etc. The mapped lines were reviewed in comparison to available orthoimagery taken at different tidal levels to serve as an independent visual check on the completed mapping data.
The advantage of this mapping method is especially apparent in shallow, areas fronted by tidal flats where small changes in elevation can translate into large horizontal shifts of the shoreland zone. The resulting mapping does not necessarily replace an on the ground land survey for purposes of development review and code enforcement. It does, however, provide the Town of Kittery with a more reliable decision making and solid review tool for shoreland zoning issues. This was accomplished by utilizing a more defensible, data-driven mapping method than was available from uncorrected aerial photography just a decade or two ago.
HAT elevations vary from year to year as spring tide conditions vary over a nineteen-year lunar-based tidal cycle. Typically this year to year variation in HAT is predicted in elevation tables. So Sebago Technics designed a process to allow us to remap the HAT each year should the Town of Kittery desire more frequent revisions to its mapping. So as the HAT line rises and falls from year-to-year the Town can simply decide when it needs updated data to capture changes along Maine’s dynamic coastline and Sebago will be there to support them in their mapping needs