The world today is very much a digital age of discovery, with powerful and dynamic information at one’s fingertips. Individuals may not be aware but, geospatial technology is one of the most powerful experiences to behold every day. The limitless applications of the geospatial world are now so familiar, various handheld devices were meager and difficult concepts to grasp only 20 years ago. Portable computing devices in phones and cars can determine one’s location by using precise coordinate data and leveraging predefined maps of every location around the world. Through the discipline of Geomatics, technology defining spatial relationships of artificial and natural objects can be collected and defined in true three-dimensional form.
What is the difference between GIS and Geomatics?
Geographic Information Systems (GIS), and Geomatics are commonly mistaken to mean the same thing, but the two fields are very different.
Geomatics is the discipline of gathering, storing, processing, and delivering spatially referenced information. It encompasses the fields of surveying, mapping, remote sensing (LiDAR or HDS Scanning), photogrammetry, hydrography, global positioning systems (GPS), and geographic information systems (GIS). It is often an umbrella term for every method and tool from data acquisition, to distribution including math, computers, and Earth science.
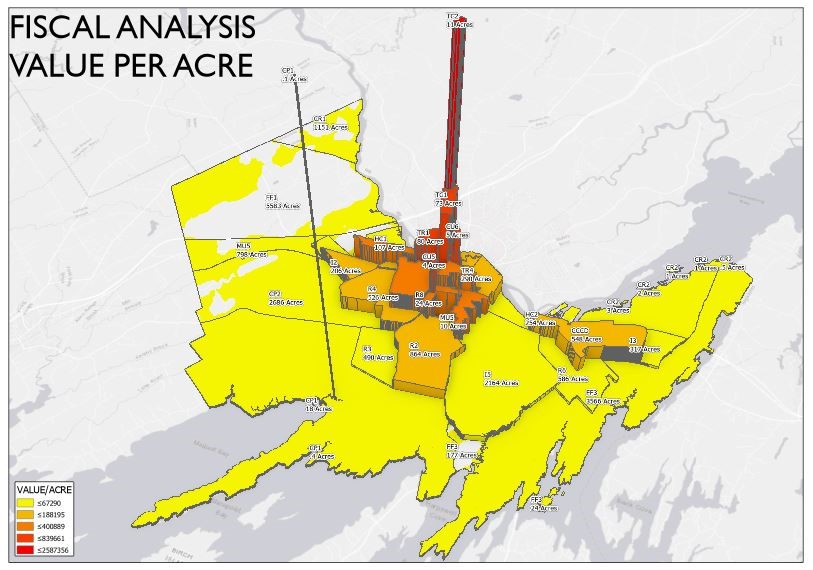
GIS is composed of a spatial database, a graphic user interface, and a set of tools to manipulate spatial data. It is a framework for gathering, managing, and analyzing. Rooted in the science of geography, GIS integrates many types of data, analyzes spatial location, and organized layers of information into visualizations, using maps and 3D landscapes. It can reveal deeper insights into data, such as patterns, relationships, and situations. Thus, helping clients and users make smarter decisions.
Geomatics
Geomatics is a broad field and includes land surveying, underwater soundings (Bathometric information), LiDAR/photogrammetry from an airplane or UAV, and laser scanning. Land Surveying is also a broad term, generally describing any activity involving property lines, property descriptions, property monumentation, or the historic documentation of any of the above. These activities are combined with other forms of mapping for design purposes or eventual construction layout services.
Surveyors typically support civil engineers in design work. They provide “site” information, aiding in physical construction activities and reassurance that accurate designs will relate directly to existing site conditions. Through this stage, land surveyors perform construction layout services assisting in accurately locating or “staking out” the construction of physical structures. Although land surveying typically uses single-point measurements, it is used to validate common technologies within the Geomatics discipline, such as laser scanning and UAV data.
Photogrammetry
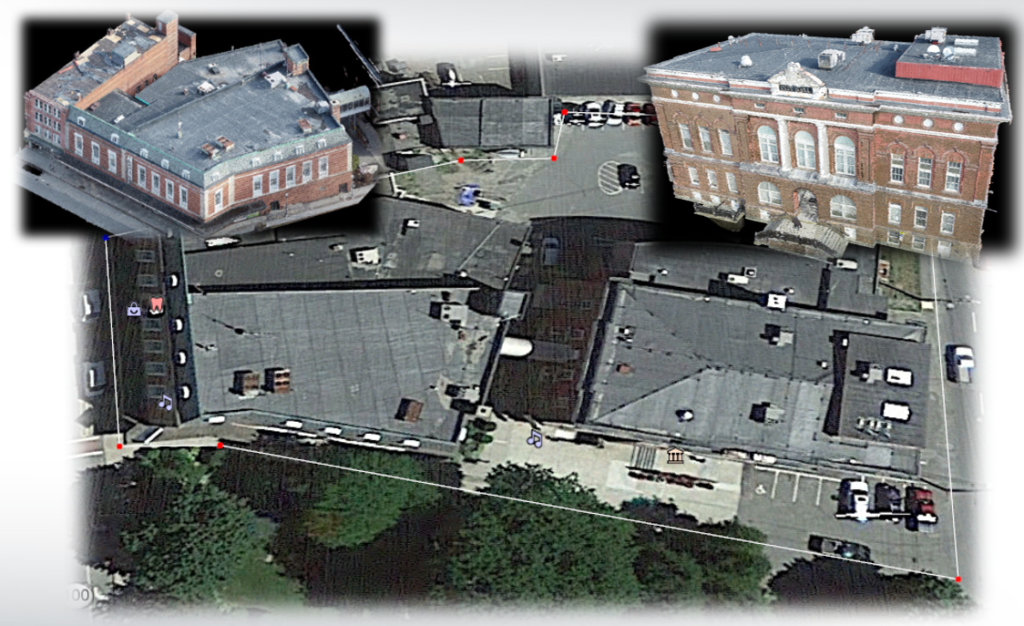
Remote Sensing is a type of measurement systems which collects data from the air using LiDAR or UAV photogrammetry. Photogrammetry often ties to or supplements LiDAR, by applying high-resolution pictures taken from an aircraft or UAV several hundred feet off the ground. Overlapping and tying together these images with the survey control by aerial targets on the ground, resulting in an ortho-rectifying the dataset. Creating a very detailed base map with accurate coordinate information of large sites quickly.
High-Definition Laser Scanning
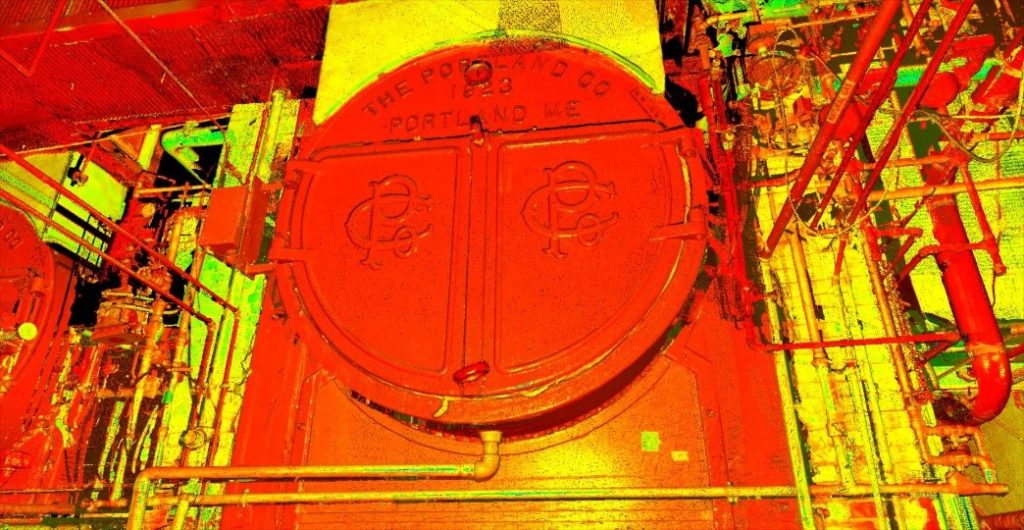
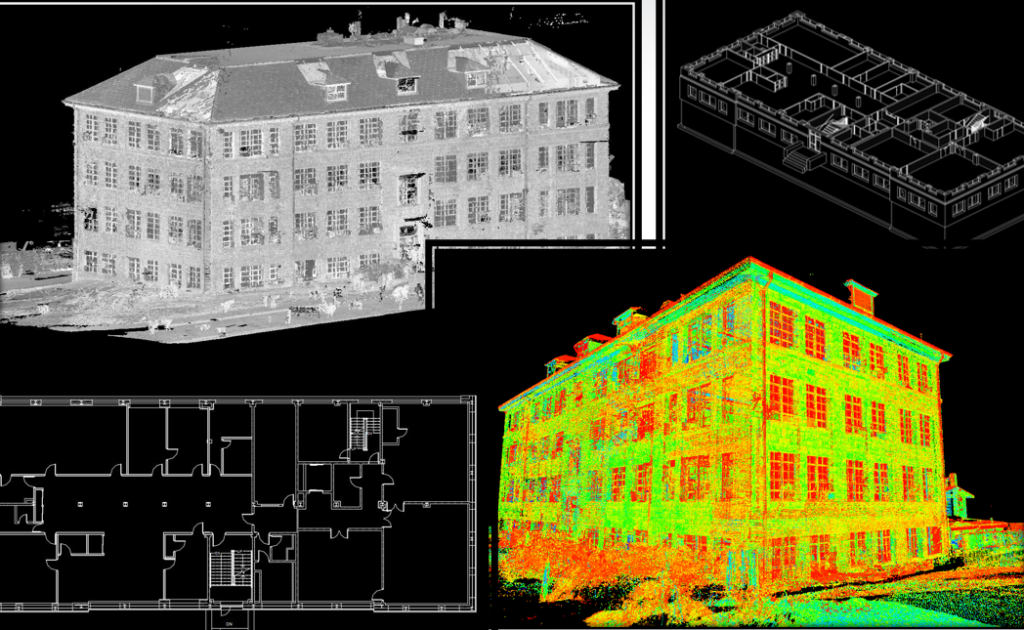
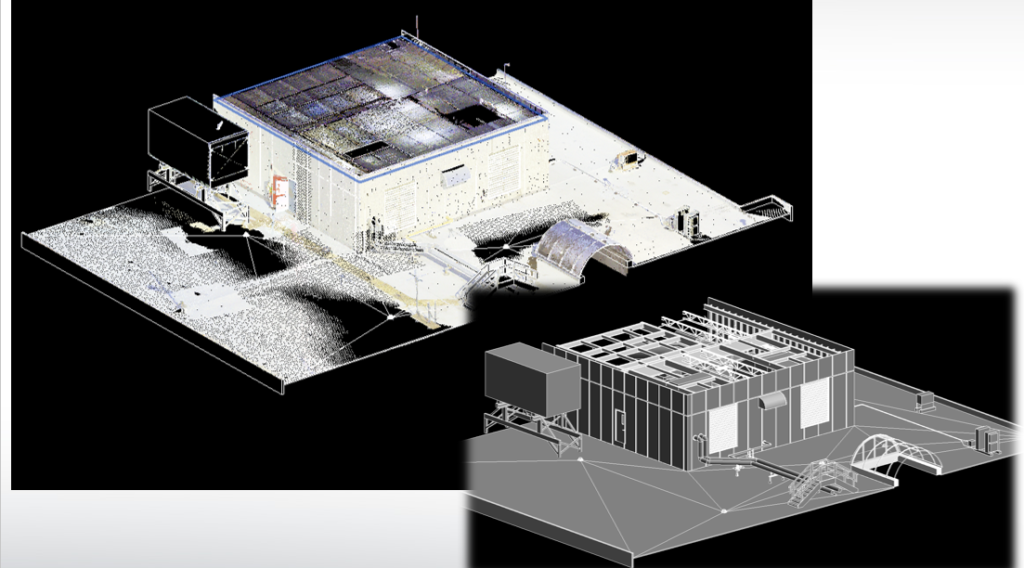
High-Definition Laser Scanning (HDS) is another Geomatics system application, which can collect large geographic areas or more complicated geometric projects more efficiently and effectively than traditional survey techniques. HDS equipment mounted on survey tripods is operated similarly to a surveyor’s robotic total station. The geomatics technician moves the laser scanner unit from set up to set up collecting site data and control survey data, for use in accuracy validation and survey-grade geolocation. With scanners now collecting data at 500,000 points per second, collecting survey-grade point data takes only minutes per set up, where previously it would have taken upwards of 45 minutes to an hour.
This technology uses various laser wavelengths and strengths to determine the distance to objects by continuous reflectorless observations. It detects items such as structures, surfaces, and anything physical which will return a laser impulse. These results generate thousands to millions of data points, combined to create a point cloud data set. This is geometrically exact, allowing a very detailed existing condition design to be extracted and created.
3D Modeling and Point Cloud Data
Finally, the drafting/processing of a point cloud data set displays the physical features of the project in digital form. This is done via software such as AutoCAD, REVIT, and other design software platforms. Alternate file type deliverables such as ReCap (.RCP) and Leica Tru-View data sets, can take the place of traditional DWG linework and mesh extraction.
These are means of a project deliverable where project budgets are tight, or a client’s in-house modeling capabilities are such that it can be self-performed. ReCap is the engine that allows Autodesk design AutoCAD, Revit, 3DS Max to directly import the registered point cloud, serving as the ‘in-product’ point cloud viewer. Earlier 2014-2015 Autodesk versions of point cloud plug-ins were limited to a maximum of 2 billion points, but ReCap now touts a maximum limit of 20 billion points!
The increased maximum limit of points leads to a more concise import of raw point cloud information, allowing for more precise and accurate processing and analysis. These ever-growing positive attributes come with a few drawbacks, if not properly addressed prior to the uploading of a published RCP. Recap Project file sizes can be very large, commonly approaching the 1TB size for a typical density scan project of an exterior and interior 3-4 level building.
Leica TruView data sets are another example of an alternative project deliverable. Published from the point cloud data set, TruView allows access to the survey point cloud and images with a multitude of tools. Aiding in visualization and collaboration, including virtual measurements, markups, snapshots, GeoTags and Hyperlinks. Using TruView is intuitive – no CAD or 3D experience required. The Leica TruView software is a free download and is accessible from any browser on any device.
Additionally, supplemental datasets such as TruView allows for inclusive collaboration of the project team. It’s used as an information resource to aid with critical project decisions, design changes, and/or modifications. The engineering/architecture industry as a whole is recognizing the benefits derived from utilizing laser scanning, resulting point cloud data, and non-traditional deliverables such as Recap and TruView.
For most applications, the data collection is more rapid than data processing because of the tremendous amount of data that is acquired in a short timeframe. HDS has found applications in every facet from architectural modeling, historical preservation, and civil engineering design, to manufacturing and processing facilities, addition/ renovations of industrial plants, and mechanical, electrical, piping (MEP) engineering system designs.
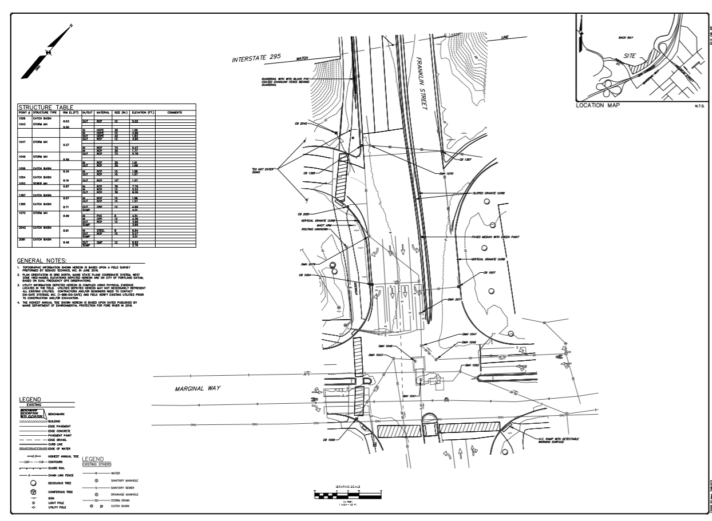
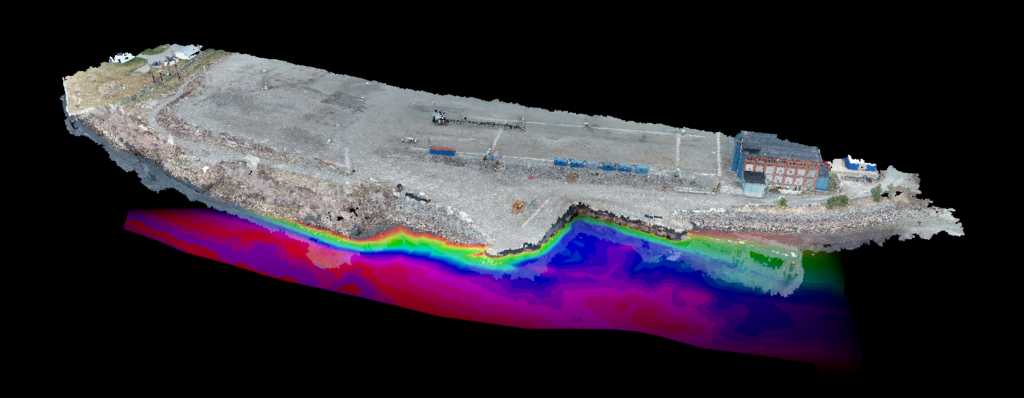
Hydrography uses a combination of land-based GPS control, boat-mounted GPS receivers, and sounding equipment used to accurately map the surface below bodies of water. The generation of site accurate contour maps and the detection of underwater structures is useful for maritime design work tying directly to a land-based facility or site.
By using a combination of these Geomatics elements together, for design purposes, Geographic Information System (GIS), allows for an in-depth, concise, and accurate analysis of the three-dimensional world as it currently exists. This was only imaginable just years ago. Project deliverables can now be customized to each project based on the needs of the client. From point cloud data, for the purpose of modeling existing conditions, to full survey topographic base plans complete with underground utilities.
Geomatics is an enormous professional field of work and study. These services are some of the most exciting and ever-evolving technologies, in which the applications are only limited by one’s imagination.